Recently, there are concerns that deep-water circulation in the East Sea is weakening, which could lead to changes in dissolved oxygen and carbon uptake capacity.
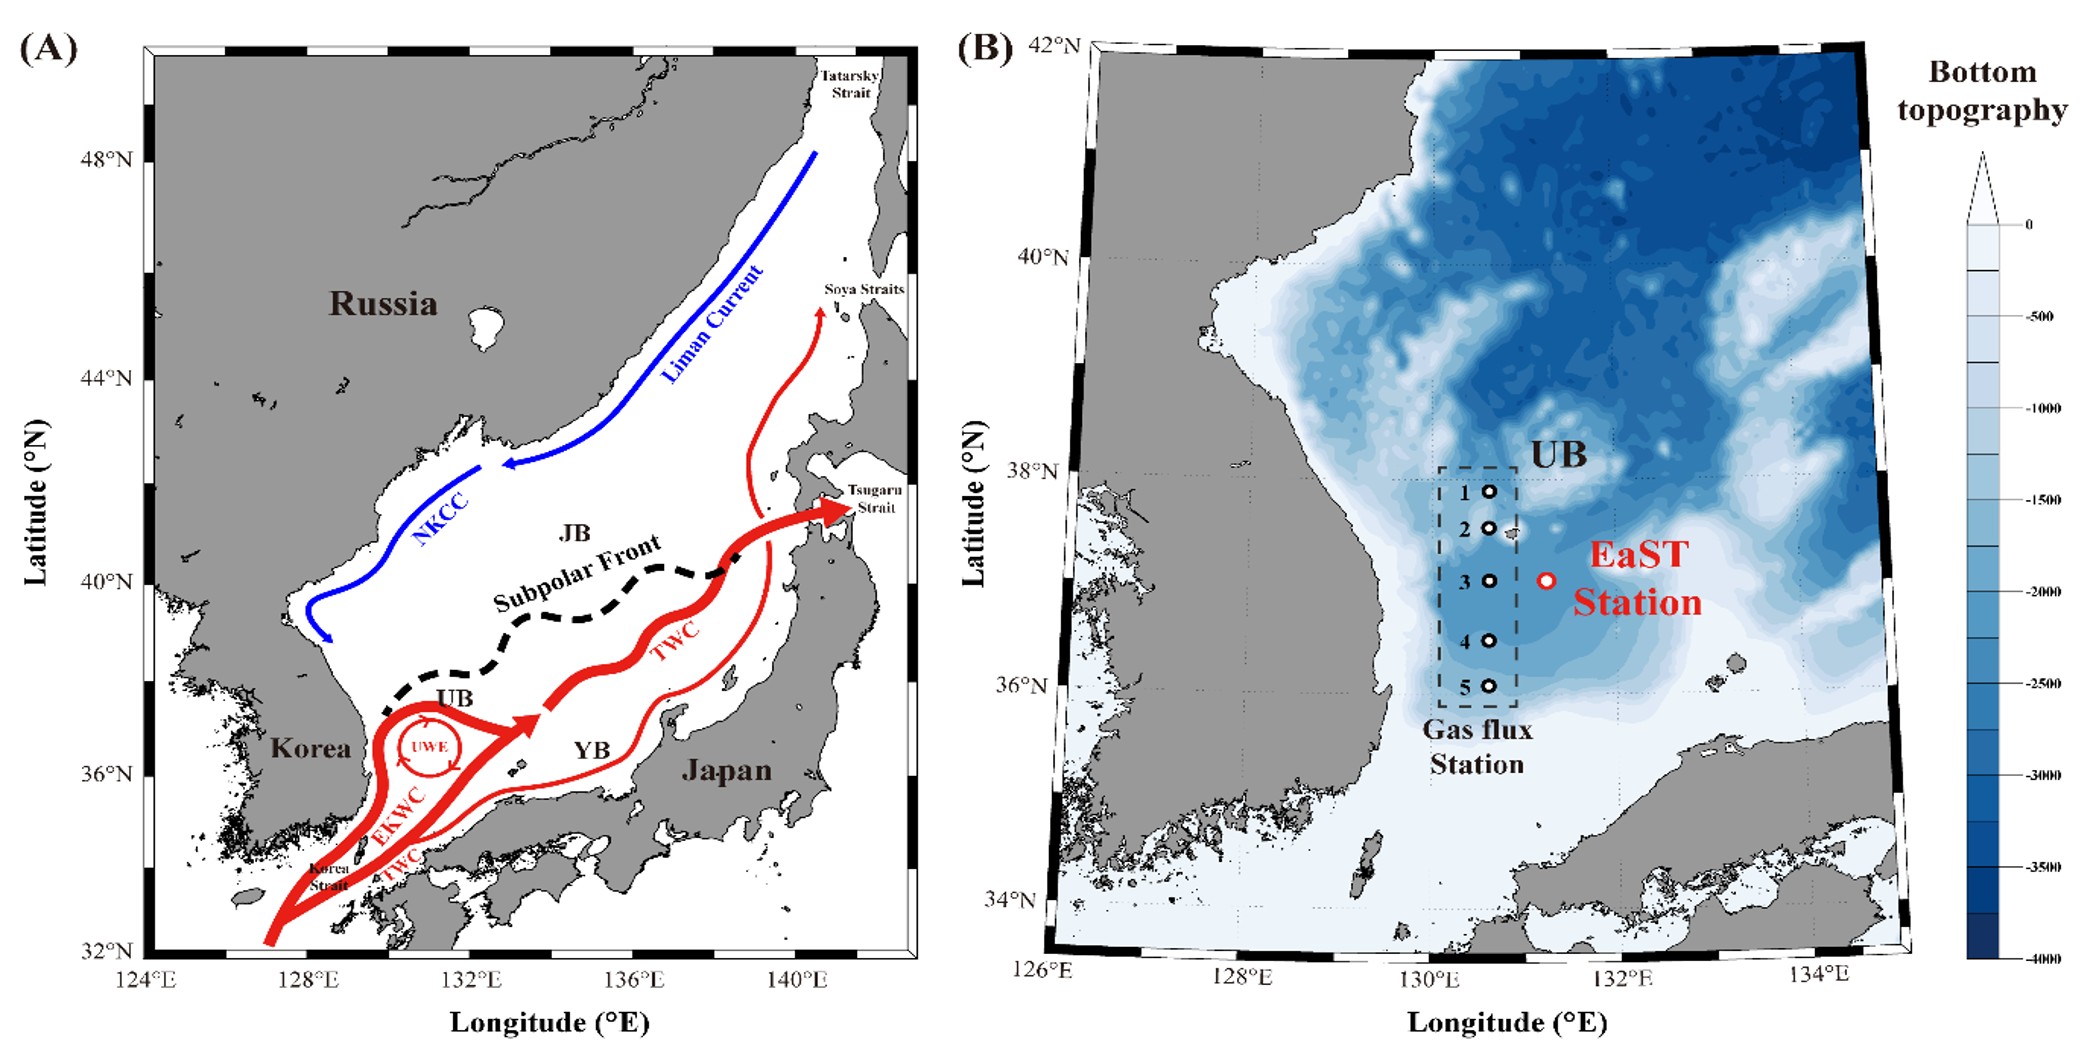
Prior to the official launch of the EaST program, a pilot observation was conducted at the EaST station in the Ulleung Basin in April 2025 to verify operational readiness.
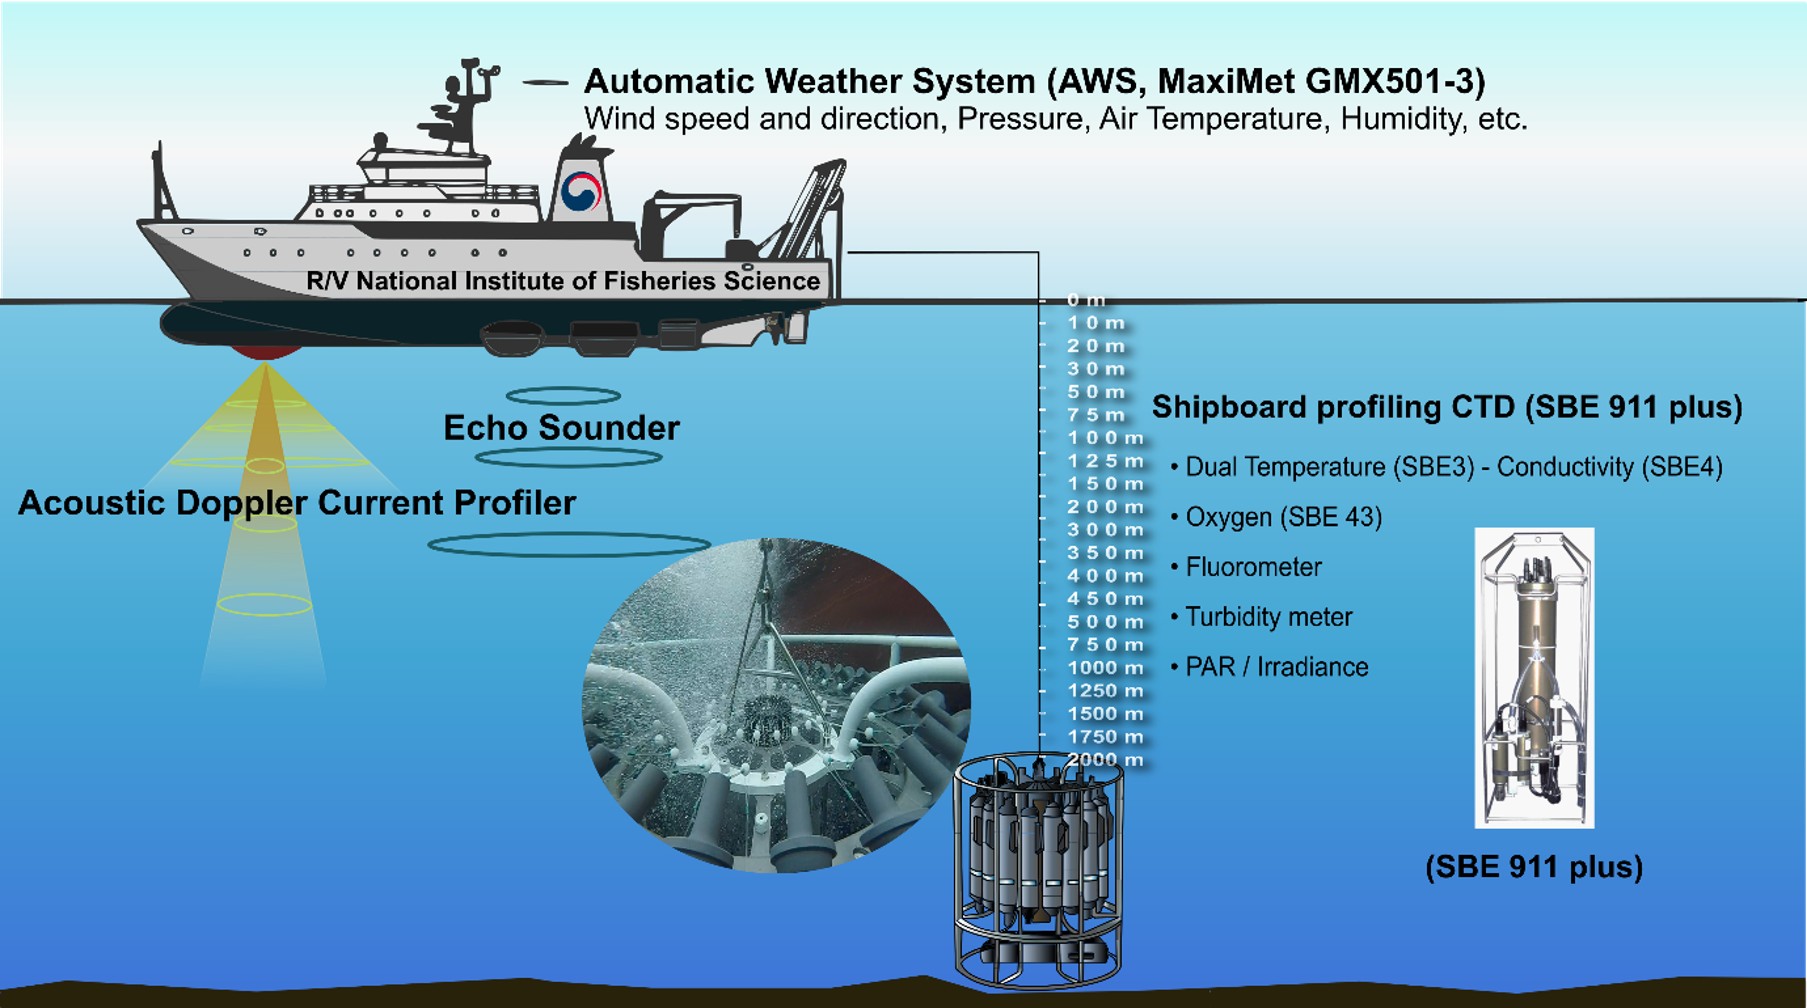
The pilot study evaluated the stability and consistency of observational instruments and analytical systems, and established a baseline dataset for future long-term observations.
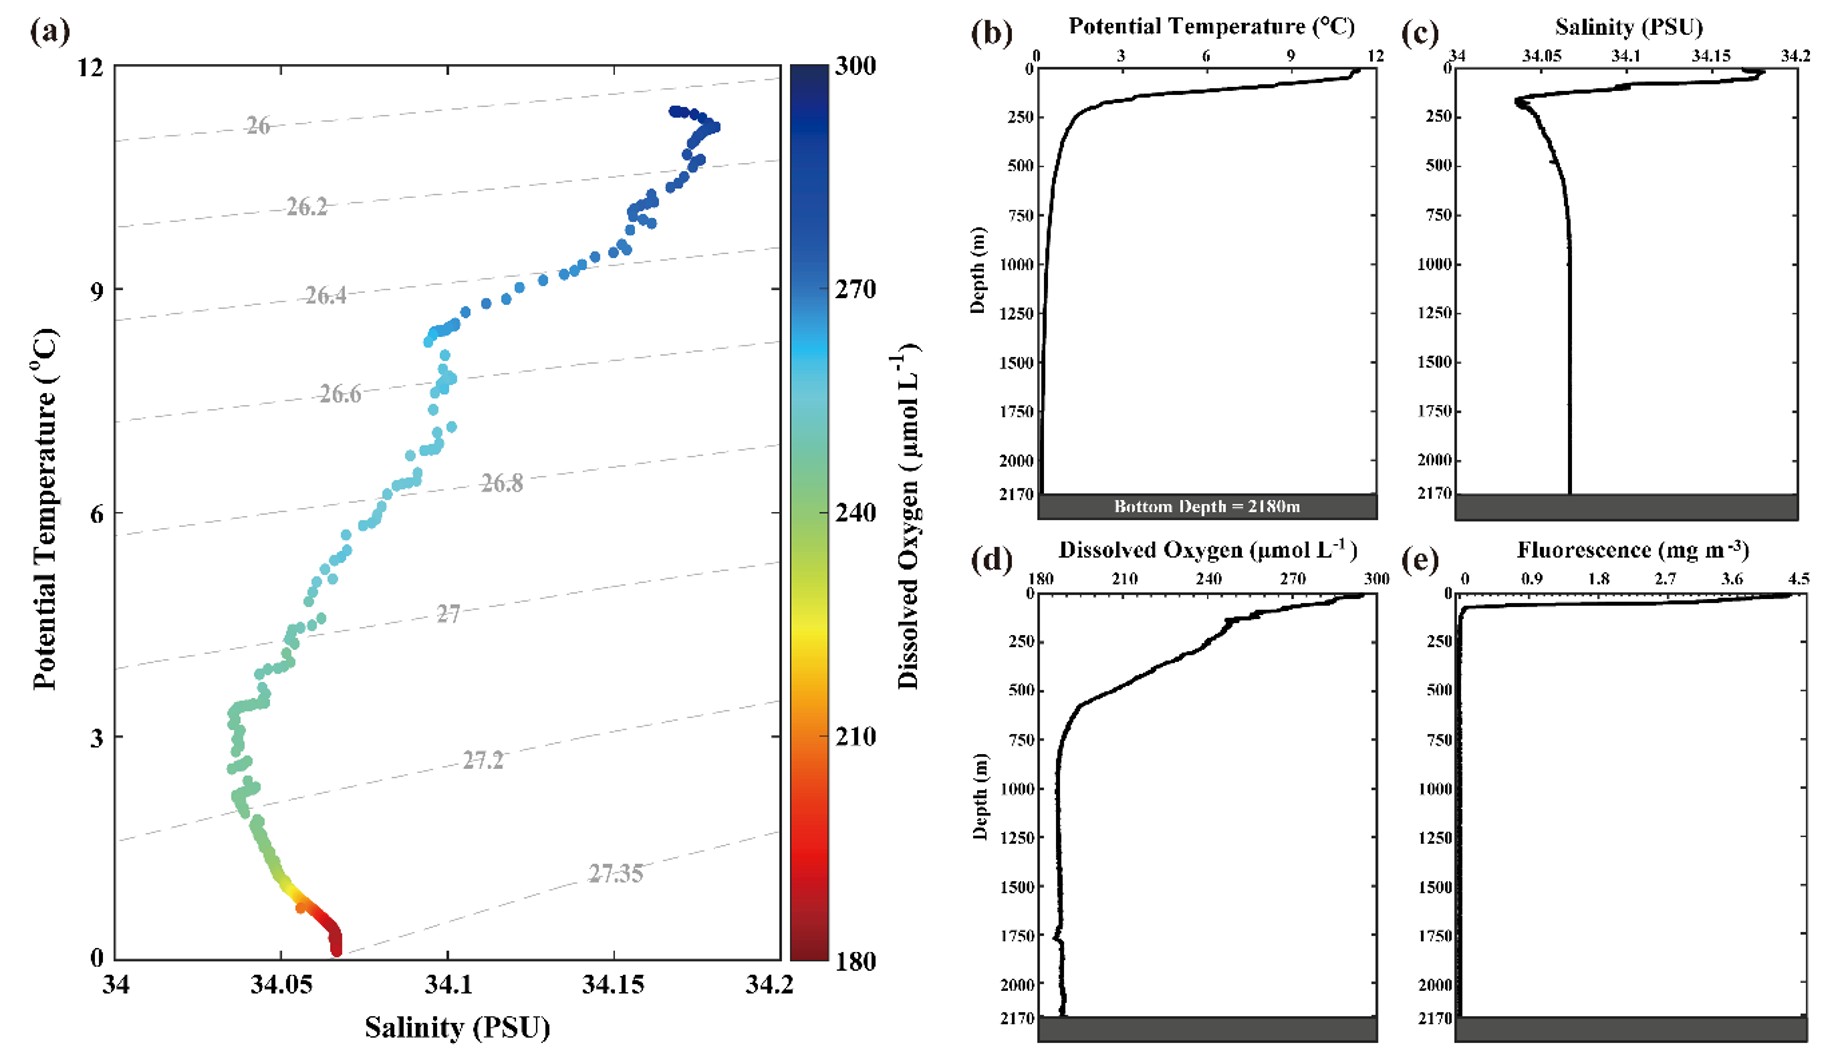
Analysis of temperature, salinity, and dissolved oxygen profiles confirms that the hydrographic structure observed in the Ulleung Basin is representative of the East Sea water-mass system.
Surface layer: Hydrographic properties strongly influenced by the Tsushima Warm Current, reflecting active exchange with warm inflowing waters.
Intermediate layer: Clear identification of East Sea Intermediate Water (ESIW), characterized by a distinct salinity minimum.
Deep layer (below 500 m): Nearly uniform temperature and salinity, indicative of well-ventilated East Sea Deep Water, with persistently high dissolved oxygen concentrations.
These results demonstrate that the EaST station successfully captures the key vertical structure of the East Sea, providing a robust physical baseline for detecting future changes in stratification strength, ventilation processes, and deep-water oxygen dynamics.
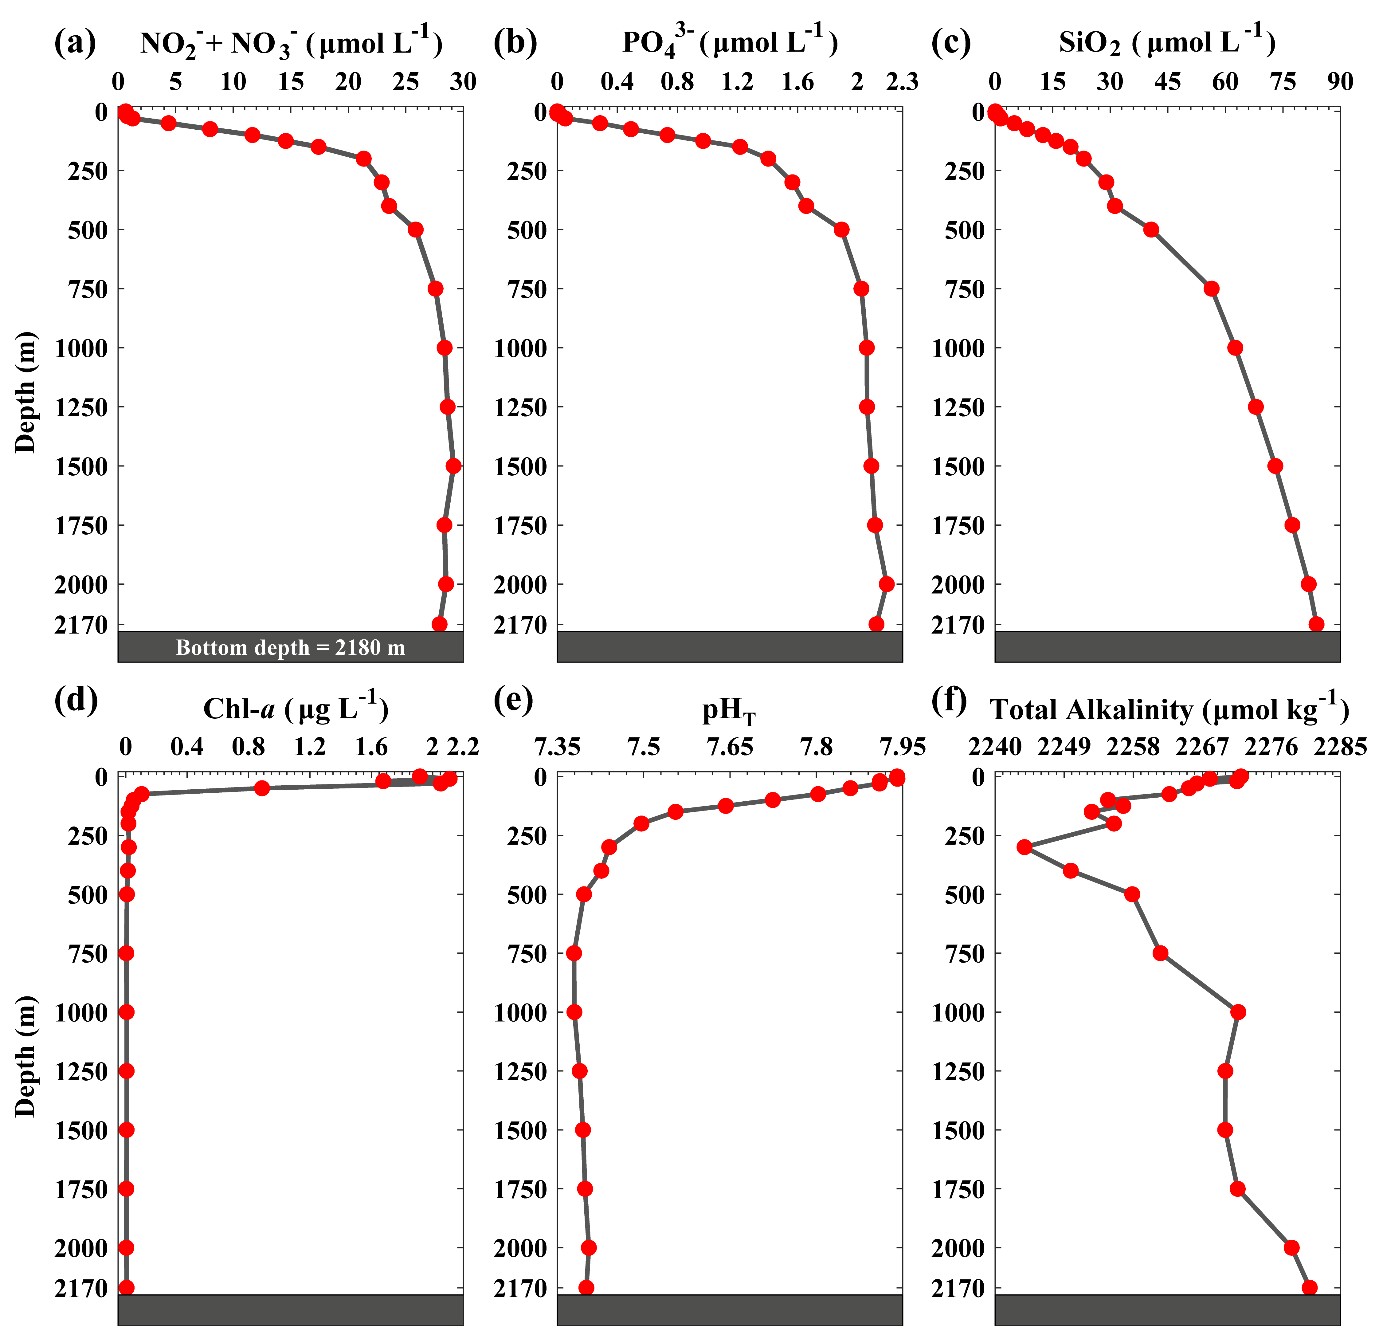
Nutrient concentrations are low in surface waters and increase rapidly with depth, followed by relatively uniform distributions in intermediate and deep waters.
Vertical nutrient patterns closely correspond to the hydrographic structure of the Ulleung Basin.
The observed distributions reflect the combined influence of physical circulation and organic matter remineralization processes in the basin.
pH values are relatively high in surface waters and decrease progressively with increasing depth.
This vertical trend is consistent with biological CO₂ uptake in the surface layer and cumulative respiratory CO₂ production in deeper waters.
Total alkalinity shows a gradual increase with depth.
The observed pattern represents a typical vertical structure of the marine carbonate system, shaped by water-mass mixing and long-term biogeochemical processes.
N₂O concentrations increase in intermediate and deep waters, with a pronounced subsurface maximum observed at approximately 700–800 m depth.
The presence of this maximum under fully oxygenated conditions suggests that N₂O production is linked to in situ processes within the well-ventilated interior of the water column, rather than to low-oxygen (denitrifying) environments.
CH₄ concentrations remain generally low throughout the water column.
A weak subsurface maximum is primarily observed in the intermediate layer, indicating that CH₄ distributions are influenced by water-mass structure and lateral transport rather than by strong local sources.
CO₂: During the observation period, CO₂ fluxes indicate net uptake from the atmosphere into the ocean.
N₂O and CH₄: Both gases exhibit net sea-to-air emissions, confirming that the surface waters act as sources of N₂O and CH₄ to the atmosphere.
These contrasting flux patterns highlight a decoupling between CO₂ uptake and N₂O and CH₄ emissions in the surface waters of the Ulleung Basin.
Instrument intercomparisons, analyses of certified reference materials, and duplicate sample measurements were conducted to verify data quality.
All observed parameters meet the target criteria for analytical precision and accuracy.
The integrated observation, analysis, and quality-control framework of the EaST program is therefore validated as suitable for sustained, long-term time-series observations.