Climatological mean temperature and salinity data around the Korean waters (1966~2023)
This is a newly developed climate dataset that provides the most precise record of changes in Korean waters.
By reanalyzing serial oceanographic observation data collected from 1966 to 2023 using state-of-the-art analytical techniques, the dataset constructs optimal monthly climatological means and long-term time series of sea temperature and salinity or the waters surrounding the Korean Peninsula. This dataset is the result of a collaborative effort between the Climate Change Research Division of the National Institute of Fisheries Science and Seoul National University (Principal Investigator: Sung-Hyun Nam). It presents high-resolution representations of the structure and variability of Korean waters, capturing marine environmental changes across seasonal variations as well as warming signals spanning multiple decades.
It serves as a reliable ocean climate–based dataset applicable across research, policy-making, industry, and education.
Data Description and Derivation Methods
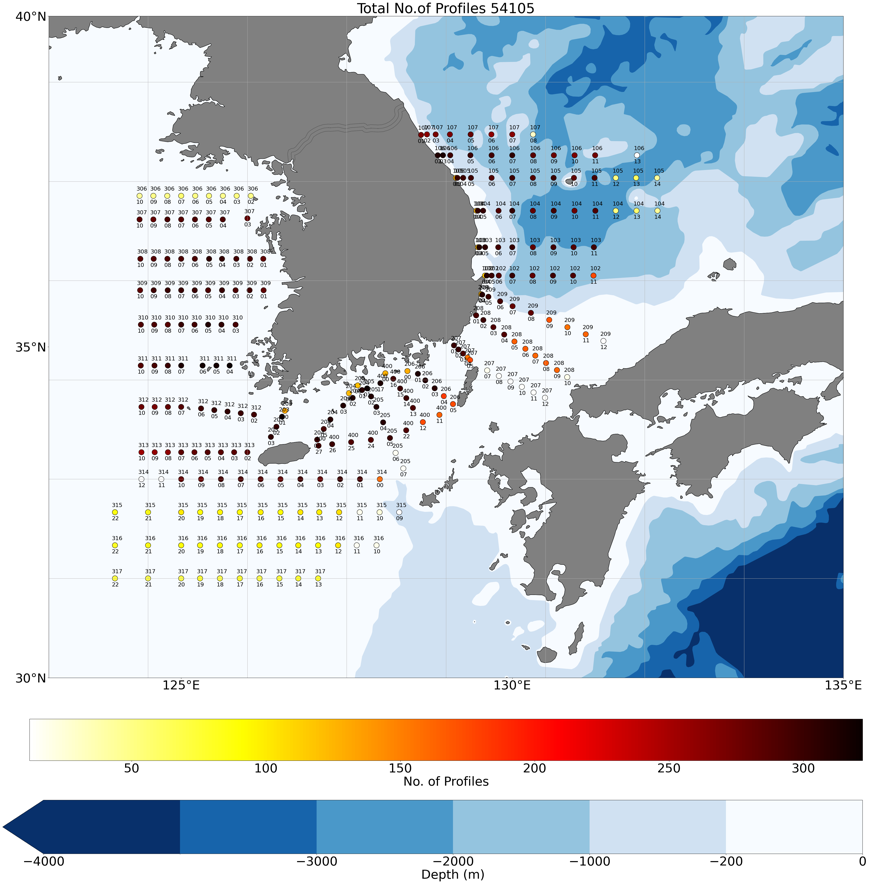
This dataset is based on temperature and salinity observations collected at 207 stations located in the waters surrounding the Korean Peninsula over approximately 60 years, from 1966 to 2023.
Systematic quality control accounting for irregular temporal intervals in the original data
Reconstruction of high-resolution gridded data through vertical and horizontal interpolation processes
1/12° grid spacing (approximately 9 km)
14 standard depth levels (surface to 500 m)
37 temporal points per year (10-day intervals), including monthly means
Derived variables: sea surface temperature (SST), sea surface salinity (SSS), and ocean heat content (OHC)